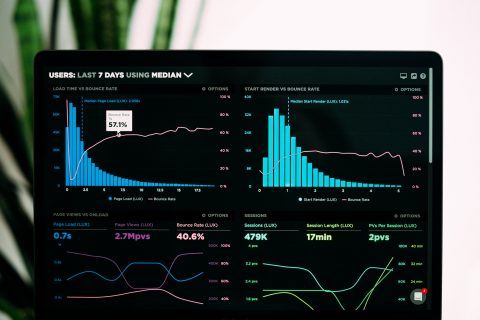
Infographics are great. As a content tool, they’re useful, easy-to-digest ways of presenting facts, information and statistics, and they’re super-shareable too. However, long gone are the days of creating a fun infographic and it actually getting all that much attention. Why? Because, well, everyone and their dog is doing it in 2022. The infographic-making market is saturated, so it’s harder to stand out. But that doesn’t mean you should forget all about them. We’ve put our heads together and thought about how you can create infographics that are still useful, so when the time comes to unleash information into the world, you’re ready with some handy tips.
Think About Who You Want To Reach

Not everyone is going to be interested in what you have to say, and that’s fine. If you’re a dog grooming company, non-pet owners aren’t going to be looking out for you, and there’s no point in trying to please everyone. What does your audience want? What would be useful to them in particular? Infographics with a purpose and a clear target are more likely to gain traction.
Is The Information Useful?
This may sound a bit daft, but you should consider the value of the information you plan to present. Will your readers actually find it interesting or useful? It’s a good idea to achieve a good balance between supplying accurate, meaningful and useful information which isn’t misleading, and there you have it, the makings for a fabulous infographic! If you want to see one we’ve done earlier, head to our above the line vs below the line blog post.
Use Imagery To Your Advantage

Although infographics are images themselves, don’t let that fool you into thinking that chucking a tonne of written content onto them makes them exciting and digestible. Use imagery to convey or back up stats and include eye-catching illustrations or images to help get the general point across. Things like bar charts are helpful for making comparisons, mind maps or other diagrams are great for explaining themes and you can even throw in some real-life photos if they fit in with your theme.
Less Is Sometimes More
You’ve heard the term before, and with infographics, in some cases, less is more. Long, complicated, overcrowded infographics trying to tell you all the information in the world are hard to read, and the chances are that the information will go in one ear and out the other. Let’s not overwhelm our audience. Keep it simple, clear, not too overcrowded and as an image, not too long either. When it comes to guidance on sizing, it does kind of depend on you (as there are lots of recommendations out there), but generally speaking, 600 pixels wide is considered the maximum (as this will fill out a blog), and length somewhere around 2,000-5,000 pixels. But again, this will depend on what you’re trying to convey and is ultimately up to you.
Make Sure It’s Easy To View
So, you’ve put a tonne of hard work into creating a targeted, simple, focused, wonderful infographic, and then when it goes into the monthly newsletter or onto the website, it’s barely readable as the font’s too small or the colours don’t work on a smaller scale. These are things to think about when designing an infographic, as the chances are it’s going to need to be resized for use on different platforms. Keeping it simplistic will help, but if it’s not easy to read, it will just get skipped over and forgotten about.
Grab Your Readers’ Attention With A Thought-Provoking Headline

Coming up with a great headline is a talent in itself, but it’s 100% achievable. A killer headline will attract your audience’s attention, then your fabulous content on the infographic will keep them there. If you’re not sure, ask for others’ opinions or thoughts, as they might surprise you and come up with something epic. Think about how your headline describes the infographic too – it needs to be on topic. Also, don’t make it too long, relatively short and catchy means viewers can scan it without much effort.
Prove You’re Not Making It Up
If you’re using statistics of some sort in your infographic, let your readers know that these have come from reputable sources, or are based on your own first-party data findings. Anyone can make up a statistic out of thin air to shock someone into reading their content, so just pop a small references or citations section onto the end of your infographic so anyone wishing to share or use your content knows that you’re a trustworthy source.
Think About How Things Flow

Guiding a reader through your infographic as seamlessly as possible is important. Why? Because it can help to keep them engaged for longer. Chucking all the stats you have into an un-cohesive pattern just to try and get a few points across will be confusing and more challenging to get through, so think about the flow, or the story you’re trying to tell with your infographic.
What’s the most important fact you plan to include? What are you trying to tell you readers? How can you showcase that in a succinct and clear fashion that guides them nicely through the information?
Numbering can work well as an aid to demonstrate flow, distinct sections, sub headers, arrows etc. Be creative and see what you can come up with.
Happy infographic creating!


Leave a Reply