Over my time working with Google Analytics accounts I have come across many reasons to use Event Tracking, so much so that I now wonder why there are still websites out there that do not utilise this fantastic resource. Here, I’m going to explain what it is, the benefits, the code and examples, covering my favourite things to use Event Tracking for.
With just a small amount of extra code, you can start collecting data on a whole host of additional activities that happen on your website which cannot be tracked with the standard Google Analytics code. From clicks on buttons or links, to how much of a form was filled in and even organic keyword rank data!
The data is also completely custom to you – you get to choose 4 pieces of information to pass into Google Analytics, specific to each activity.
Event Tracking works through passing the following information to Google Analytics:
Category, Action, Label and Value
There is one other field that can be used in the code, non-interaction, but this does not pass any additional data, so we’ll come back to it later. Also, you don’t need to include a tag saying which page the Event happened on, as this is captured through the standard trackPageview functionality.
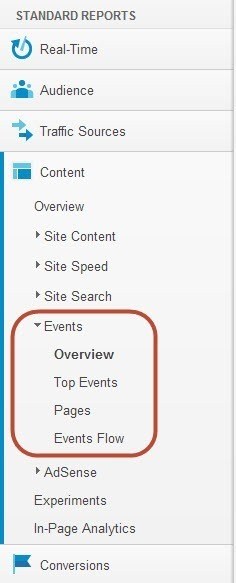
The data comes under the Content Report, then Events. Have a look at how the information is accessed before deciding on how to label the activities on your website. You will want to consider grouping similar activities in to the same action, which can then be broken down by category and label, rather than having too many differing actions. Similarly with categories, try to find ways to define these in order to enable you to group them and analyse similar ones together, whilst maintaining the ability to break them down through labels and actions.
I’ll cover some examples of how to name your activities in each of the examples below so that you start to get a feel for what you can do.
Basic Event Tracking Code
Broken down to the basics, the code is structured like so:
_trackEvent(category, action, opt_label, opt_value, opt_noninteraction)
Replace each aspect with the data that you want reported. Although you only need to include category and action, the others are optional.
As an example, to track PDF downloads of a Whitepaper called SEO is Great, I have chosen to use:
- A category for all my Whitepaper activity
- An action of ‘download’ for all downloads across the site
- A label to distinguish which resource sees the activity
- A value of 5 (based on the perceived value or arbitrary scale, whatever works for your business)
- A non-interaction setting of true (meaning I do not want activity here to impact by bounce rate)
Which in its most basic format would be:
_trackEvent(‘whitepaper’, ‘download’, ‘SEO is great’, 5, true)
The important thing to remember, is that if you want the Event to fire data when someone clicks something, you will need to put the code inside an onClick function, like so:
onClick=”_gaq.push([‘_trackEvent’, ‘whitepaper’, ‘download’, ‘SEO is great’, 5, true]);”
In this example, we’re tracking clicks of a PDF, so the full code of the link would be:
<a href=”/downloads/whitepapers/seo-is-great.pdf” onClick=”_gaq.push([‘_trackEvent’, ‘whitepaper’, ‘download’, ‘SEO is great’, 5, true]);” target=”_blank”>SEO Is Great Whitepaper</a>
You can see how the extra line of code just sits inside the code for the link and after you’ve done it once you can use the same example but just replace the bits that need to change. Copy and paste is your best friend when you’re not a coder!
Additionally, because it is JavaScript, you can insert the data dynamically, instead of using static information. For example:
<a href=”/downloads/whitepapers/seo-is-great.pdf” onClick=”_gaq.push([‘_trackEvent’, ‘whitepaper’, ‘download’, pdfName, pdfValue, true]);” target=”_blank”>SEO Is Great Whitepaper</a>
In this example you would have to define the pdfName and pdfValue variables elsewhere in the code, so that the JavaScript knows which bit of information to pull in.
Events and Bounce Rate
When using Event Tracking on a website, you will need to be aware that Events will impact the bounce rate of the page because by default, Events count as an interaction (not a bounce) in the same way as visiting another page.
If you do not want Events to impact your bounce rate in this way, you will need to use the non-interaction part of the code to specify that it should not be counted as an interaction and thus, should be ignored for the bounce rate calculation. To do this, set the opt_noninteraction field to true as I did in the above example.
Value of Events
As with goals and e-commerce data, having a value in your reports can give you so much more insight into performance and success, so I would highly recommend setting values wherever possible. In Event Tracking code, the value is an integer that can be used for whatever metric you want, as long as it’s a positive number.
You can either set the value based on what the Event is worth to the business, i.e. clicks of this link mean someone has purchased something worth £12, so the value should be set as 12.
If you don’t know what value something has or if it’s for things of varying total value, you can try and work it out based on the average final revenue and then times this by the conversion rate (the likelihood you will get revenue from the Event) to work out how much each Event could be contributing.
Alternatively, if you have no real way of working out actual revenue, you can set the values as arbitrary numbers on a scale of importance. This will help you compare a visits/pages/traffic sources that have measured 100 low importance interactions compared to visits/pages/traffic sources that have measured just a couple of very high importance Events.
Using either method here will then give you a much better idea of how things are performing, especially when you’re tracking more than one type of Event.
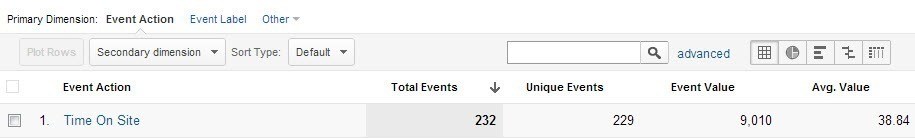
Alternatively, you may choose to use the value field for another metric such as time (for tracking videos watched or time on site) or as search engines ranking position. If you use these then you may want to make sure that everyone reporting from your Google Analytics account is aware that these values are not money!
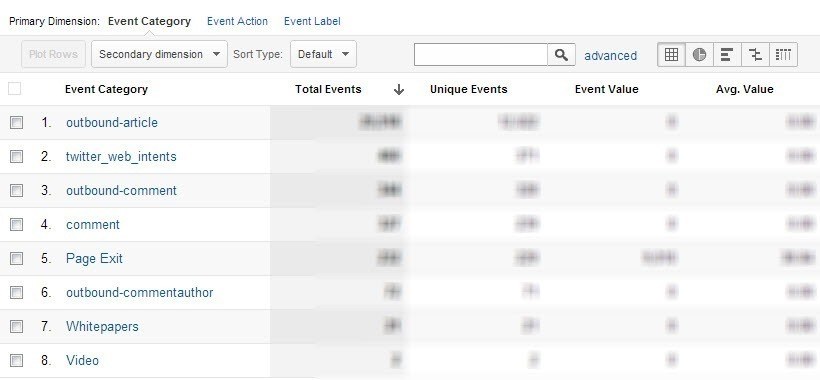
Reporting on Events in Google Analytics
Before I dive into all the examples, let’s take a quick look at how the data is reported and what you can get from it.
 Here are the core metrics:
- Total Events: How many Events were recorded
- Unique Events: How many unique actions happened (de-duped version of total Events)
- Event Value: The total value recorded (only you know whether it’s £, $, time or another metric!)
- Avg. Value: The average value across all Events
- Visits with Event: How many visits contained an Event
- Events / Visit: The average number of Events recorded per Visit
These are then broken down by Category, Action, Label (or a combination of these) and the data can also be reviewed by the pages on which Events happened.
Once you have chosen dimension to break the data down by (i.e. a category that you want to analyse), the data will be shown in more depth for this and a breadcrumb appears at the top allowing you to change this or go back to All.
I would also recommend tracking your most important Events as goals so that you can see data relating to these in the standard reports against other data and use the metrics to help you work out the value and ROI of your website.
Event Tracking Examples, You Say?
So now you’ve got the basics, let’s crack on with some examples of when and how you can use Event Tracking to take your web analytics to the next level! The methods I’m going to cover are:
Basic tracking of clicks/interaction:
- External links
- Internal banners
- Sign-ups, log-ins and form submissions
- Downloads
Medium difficulty:
- Gadgets
- Videos
- Social sharing button interaction
Advanced but awesome:
- Rank tracking (easy implementation and awesome data!)
- Form completion progress/ drop out
- Scroll reach
Basic Tracking (Easiest Difficulty)
These event tracking functions are easiest to implement and provide some really valuable and often essential information about user behaviour.
Tracking Clicks and Interaction
This is the most common use for Event Tracking – how many times people click on a certain thing. The only limit here is your imagination! If you’re not sure where to start, take a screen shot of a couple of pages of your website and circle all the things that users can click, then think about what value and use each of these actions is to you. From this you can decide what to track and what naming structure you might need to use to organise the data.
Clicks on External Links
Tracking clicks on links to other websites can enable you to measure the following:
- Clicks on adverts
- Click through to sister sites or sub domains
- Clicks to social profiles
- Clicks to the resources you have provided
- Clicks to your YouTube Channel or other sites you’re promoting
- Clicks on AdSense and affiliate links
- Clicks on Live Chat buttons (usually an external service)
Each of these has its own benefits and some will have more significant monetary value than others, but each will be valuable data because if no one clicks the links, why should you fill your website with them? This data can help you decide which ones are of most use to your users, as well as which ones are valuable to your business.
The code for these links might looks like this:
<a href=”https://developers.google.com/analytics/devguides/collection/gajs/eventTrackerGuide” onClick=”_gaq.push([‘_trackEvent’, ‘resource’, ‘outbound link’, ‘https://developers.google.com/analytics/devguides/collection/gajs/eventTrackerGuide’, 1, true]);” target=”_blank”>Google’s Guide to Event Tracking</a>
I’ve named this as a resource clicked from an outbound link with a value of 1 and I have told it to not use clicks on this to impact the bounce rate of the page.
Internal Banner Tracking
Have you got a rotating banner on your site? Or somewhere to place a banner but you want to know which one performs best?
Adding Event Tracking code to your internal banners and carousels (rotating banners) can help you identify the best banners to use on your website – which type of content users are most interested in and which banners work best at attracting clicks. You can also tie back the data to see the goal values from users who clicked each banner to work out if any outperform others in bringing value to your business.
Not only can you track the banners themselves, but you can track the navigation buttons that people use to flick between rotating banners or forward and backwards arrows if you have them.
The code for these links might looks like this:
<a href=”#banner1″ onClick=”_gaq.push([‘_trackEvent’, ‘banner’, ‘internal link’, ‘banner 1’]);”>1</a>
So here I am labelling the action as a click on an internal link, with the category banner. I’ve used the label field to specify which banner it is (yours should have a more informative name than 1!). I’ve decided to remove the value and non-interaction fields, as I don’t see a value being attributed to this click and it counts as interaction to further content on my website. Therefore, I’m happy for this click to stop the views being counted as a bounce.
Signups, Log-ins and Form Submissions
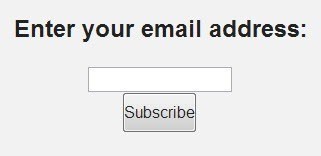 Have you got any forms on the site where users can throw in some details and click go? Whether it’s signing up, signing in or signing their life away, you can track it! All you need to do is put the code on the submit button and you will be able to track how many times this is clicked.
<input type=”submit” onClick=”_gaq.push([‘_trackEvent’, ‘form, ‘submit’, ’email subscription’, 10]);” value=”Subscribe to our email” />
You should be starting to see the pattern now, this example uses the category form, so that we can track other interactions from forms within the same place. The action is ‘submit’, with the label specifying which form it was, the value being 10, which is left to count towards the bounce rate.
Downloads
Throughout your site you might have files that people can open or download, but you can’t tag these pages with Google Analytics. The closest you can get is to tag clicks to open/download the files.
As above, a way to track downloads as Events is:
<a href=”/downloads/whitepapers/seo-is-great.pdf” onClick=”_gaq.push([‘_trackEvent’, ‘whitepaper’, ‘download’, ‘SEO is great’, 5, true]);” target=”_blank”>SEO Is Great Whitepaper</a>
Whether you’re promoting Whitepapers, flyers, fact sheets, spreadsheets or other items, you can set up Event Tracking to measure when they are clicked, as well as how many unique clicks they see and what value this provides to you.
Medium Difficulty
These examples might need slightly more code knowledge or research to get right, but don’t let this put you off!
Gadgets
If you have interactive gadgets or widgets of any kind on your site, such as ratings, feedback pop ups, liked-that-try-this pop ups, calendar buttons or polls, you can add Event Tracking to get an idea of how much these are used and which ones work best.
I’ve put this under the middle difficulty section as some of these will require some extra code to get working, but a simple implementation might be:
<a href=”#” id=”submit_feedback” onClick=”_gaq.push([‘_trackEvent’, ‘feedback’, ‘submit’, ‘Did you find this useful?’,, true]);” target=”_blank”>Submit</a>
Here I have used the category ‘feedback’, so that any forms that also use the ‘submit’ action can be analysed individually by category, as well as all submission data being shown within the same data set. This allows for in-depth analysis of visits with anything submitted.
Videos
So you have videos on your site and stats on these through the video hosting platform – but how do you tie the success of these in with other data you have about activity on your site? By tagging the Play, Pause and Stop buttons with Event Tracking of course!
You can even set up Event Tracking to record how many seconds of the video was watched before the user stopped it.
Due to the way that videos are built into websites, you may find that you need to modify the code to work properly, but the final outcome you’d be looking to see will be something like:
onClick=”_gaq.push([‘_trackEvent’, ‘videos’, ‘play’, ‘video marketing is awesome’,]);”
Or for video duration:
_gaq.push([‘_trackEvent’, ‘videos’, ‘video duration’, ‘video marketing is awesome’, videoDuration]);
Rather than provide an additional 2,000 words on how to set everything up, here are some resources to get you started, depending on how you’re using videos:
Here’s a JavaScript library that in a few short steps can get your video activity tracking as Events (although with the naming convention that they have set, rather than one you choose yourself).
Here’s how to put Event Tracking code in Flash videos (and using FlowPlayer to make videos easier to handle on your site) by Luna Metrics.
Wistia users can follow this guide for embedding Event Tracking in their videos.
Social Sharing Button Interaction
Depending on how you have added social sharing buttons on your website will depend on how you can track the activity. You will also need to decide if you want to use Event Tracking for social media or whether the Social reports would be better for you. The Social report can give you more detailed and integrated data, see this guide for implementation and this blog post for using the Social reports in Google Analytics.
I do think that social tracking is best done within the Social reports, but if you still want to see this interaction as Events, here’s how:
If you’ve coded your social buttons yourself, you can manually add Event Tracking code around these, like so:
To add Event Tracking code to Twitter buttons:
<a href=”https://twitter.com/koozai_anna” onClick=”_gaq.push([‘_trackEvent’, ‘social media’, ‘twitter’, ‘Koozai_Anna’]);” target=”_blank”>Koozai_Anna on Twitter</a>
To add Event Tracking code to Facebook buttons:
<a href=”https://en-gb.facebook.com/koozai” onClick=”_gaq.push([‘_trackEvent’, ‘social media’, ‘facebook’, ‘Koozai on Facebook’]);” target=”_blank”>Koozai on Facebook</a>
As you can see, you don’t get a huge amount of information and you will require extra code to make this dynamic to save yourself having to hand code every link, but this method can work for basic set ups.
Alternatively, if you are using Twitter Web Intents, a Twitter service that can make it easy for people to follow and share your content without leaving your website, there is a full implementation guide to get this activity tracked as Events with lots of juicy information.
With Facebook, if you have used their code for Social Plugins you can work your Event Tracking in to this code using this guide.
Google+ interactivity automatically feeds data into your Social report in Google Analytics, however, if you want to put the data in to your Events report you will need to add some code. Again, Yoast has put together a tidy little guide here.
Advanced but Awesome
This section may need additional code, but it will be worth it!
Rank Tracking (easy implementation and amazing reports)
You may have heard of using a filter in Google Analytics to show organic keyword positions in the keyword report, but this method, as outlined recently by Justin Cutroni, allows for so much more than that!
For the full implementation and information about this please read the original post.
It involves adding one small section of code to your website which then enables you to pass Event Tracking data in to Google Analytics in the following way:
- Category: RankTracker (so all the data is grouped nice and easily)
- Action: the keyword the visitor used
- Label: the landing page (which in other Event Tracking is gathered through the Event page report but is very useful to grab as its own metric here)
- Value: the rank that your website was when it was clicked
- Non-interaction: True so that your bounce rate is not affected
Some of the uses for this are:
- Finding the average rank of keywords – through the average value report
- To group keywords and review performance based on the type of keyword (i.e. brand, product)
- To track rankings of keywords over time on a graph
- To see which pages perform well for which keywords
So what are you waiting for?! Get over to cutroni.com and implement this today!
Form Completion Progress and Submissions (code required)
Ever wondered how many times your forms are left incomplete? Which fields cause people to run away in fear or give up? Ever tried to guess how to improve your forms without using actual data?
Well now you can start to make informed decisions and get a detailed analysis for forms with the use of Event Tracking!
Rather than me writing the code for you, the lovely guys at Luna Metrics have recently provided a version that you can use.
There are two chunks of code involved – one to fire an Event every time a cursor leaves a form field and the second to set jQuery up. You only have to customise a few areas of the example to make it work for your form.
If you have budget available, then I would recommend using a different tool, such as ClickTale, to give you this data in a much more presentable and usable format. However, for those websites that don’t have scope for extra analytics budget, the above method is your next best alternative.
Scroll Reach (advanced implementation)
Again, you could use a dedicated tool such as ClickTale to analyse how far users scroll down your website pages, but if you want the data all in one place, you can utilise Event Tracking to measure this for you!
Now for this, I also can’t take any credit for putting the code together, the best write up on how to do this is found on Justin Cutroni’s blog and was put together by some of the best minds in web analytics!
You can find the full instructions here.
Conclusion
I think that’s enough for now! I hope that these ideas, examples of the code and resources will help you improve and get a lot from your own Event Tracking strategy. The data can be full of insights you never thought you could see! Remember though – why add the tracking code if no one’s going to use the data? Put a plan together for what metrics are going to be most useful to you and who/how they should be reported on before you decide on the implementation. This can also help you work out how best to name your Events to allow for the best analysis.
And after all that, if you need help improving the tracking on your website, we can help! Just give us a call to talk about our analytics services.
UPDATE: Unnecessary ‘ signs removed from value fields


Leave a Reply