 Google Webmaster Tools is an essential resource for webmasters with a wealth of useful information for optimising websites and identifying issues. What’s more, the tool kit was recently revamped with a new navigation structure, additional features and enhanced reports.
One such report to receive development was the Search Queries Report, located under the new Search Traffic sub-menu. What was once a very basic, approximately and fairly useless report is now the very opposite and provides information you cannot currently find anywhere else.
Where To Find The Search Queries Report In Google Webmaster Tools
For those of you who haven’t used this report in quite some time, you can get to the Search Queries report in one of two ways.
- From the Site Dashboard click the “Search Queries” bar
- Navigate directly to the report which is listed under the “Search Traffic” menu on the left.
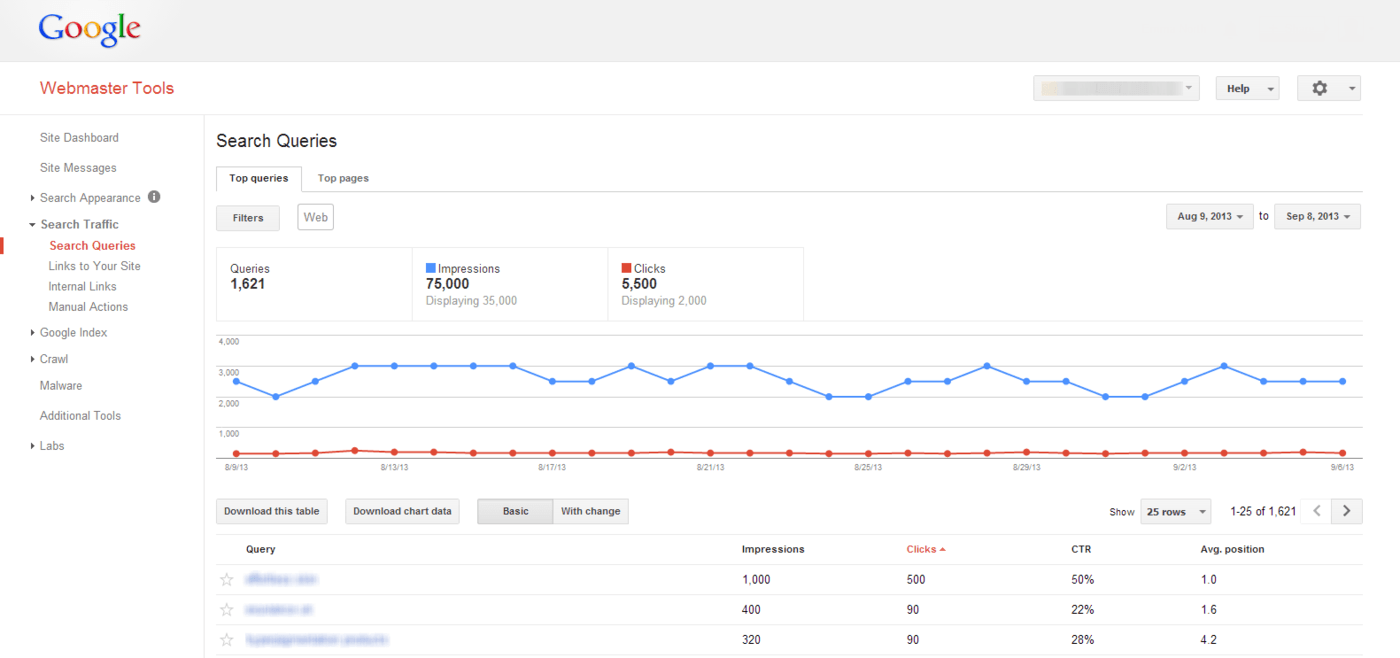
When you get there, you will see a chart and table similar to this:

Isn’t This That Rubbish Old Chart In Webmaster Tools?
Well, sort of yes. Only it isn’t quite as rubbish as you might remember.
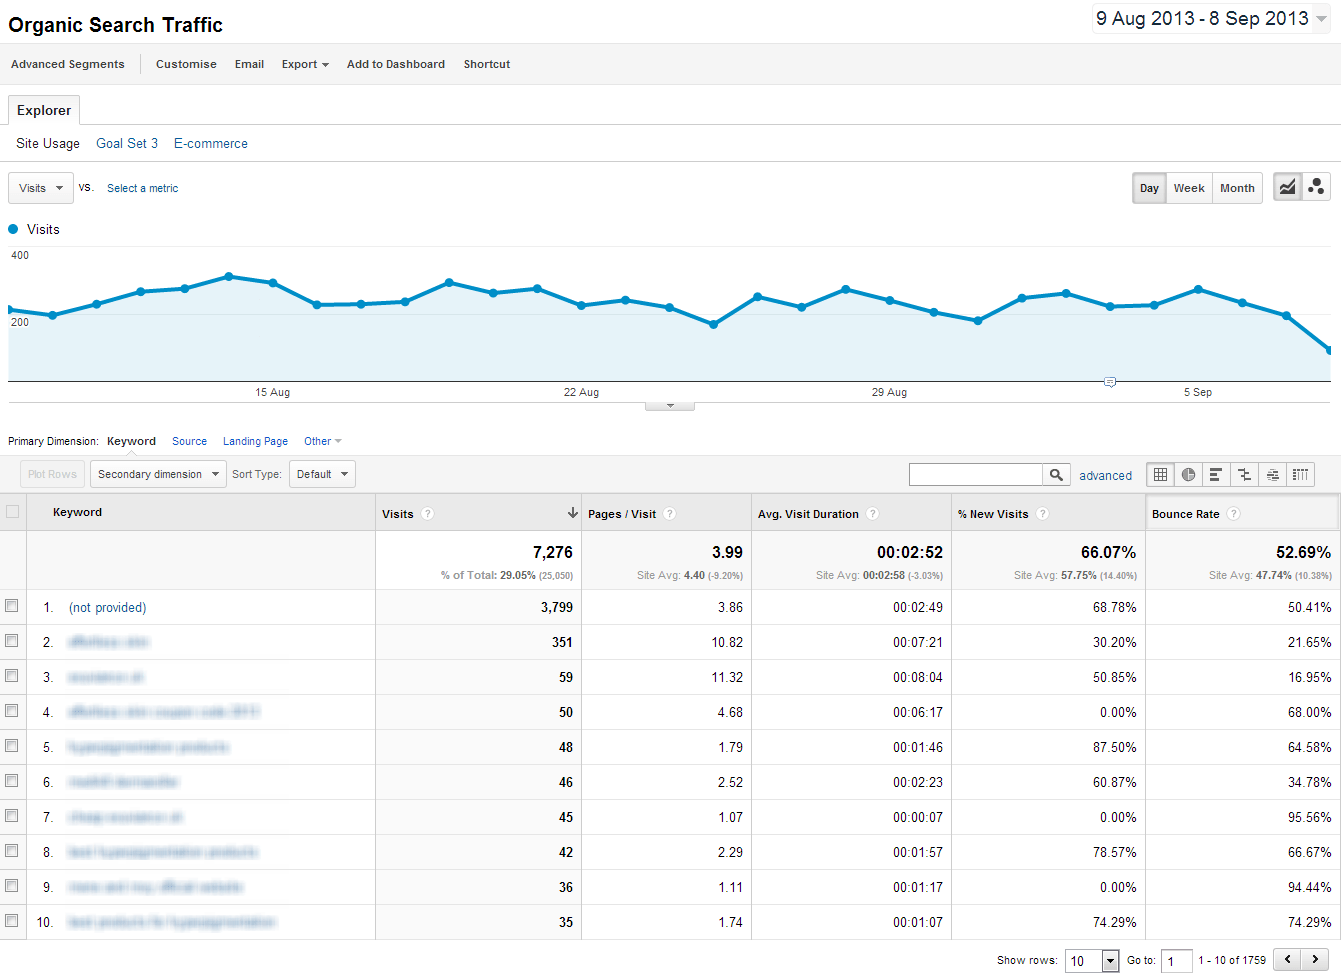
First things first, the chart itself is definitely still pretty useless, showing both organic impressions and clicks on the same scale which usually means the clicks appear as a consistent flat-line. But the actual table and the data this section provides is a lot better than it used to be. What’s more, it gives you some actual keyword data which you cannot get from anywhere else now since the (not provided) headache.
What Data Can I Find In The Search Queries Report?
The Search Queries report contains a lot of really useful information, including approximations of:
- Queries (number of different search queries for which your site was shown)
- Impressions (times your site was shown in search results for these queries)
- Clicks (how many times the user actually clicked your site in those search results)
- CTR (the Click-through Rate based on impressions vs. clicks)
- Average position (the average position of your site for each query)
- Top Pages (switch to this tab at the top to see your top pages in organic search)
All of this information can be used to evaluate your current organic performance and identify areas in need of attention. For example, if one of your most important products is shown as a search query with a low CTR or average position, it would be worth concentrating on that product or page of your site to better optimise it for search engines.
Beating (not provided)
As previously mentioned, one major benefit of this report is that you can get approximate numbers of organic visitor search terms that are shrouded beneath the (not provided) cloak in Google Analytics.

Now that we will no longer see organic keyword data in Google Analytics, the Search Queries Report has become one of the only ways we can ascertain organic search terms for analysis.
Although the data is only estimates and approximations, this is the only place you will see your Google organic search keywords at all, so it is worth embracing this report sooner rather than later.
When you review the report for keyword insight, remember to not just consider what keywords are there that are performing well but also which ones you would expect to see doing better. You can use this insight to ensure you spend time optimising the parts of your site that need it most.
The data has value on its own but is most useful when comparing different date ranges. Although there is no “compare dates” function as in Google Analytics, you can manually select and export the chart data for different date ranges and see how the performance of your keywords changes.
Track Rankings Without Breaking The Rules
Another use for this report is in that it provides approximate average positions for your keywords, something that Google’s policies state we should not be tracking in any other way.
Because you can easily select your desired date range, you can monitor ranking fluctuations month on month. You can then use this data to see which keywords are performing best and which are not ranking as well as you’d like.
What’s more, you can use the included filters to see how your average keyword rankings change with location, although this is currently limited to country level data only. Try setting different filters and seeing how the data changes and what you can learn from it.

It’s Not All About Keywords – Look At Top Landing Pages Too
While there’s no reason not to carry out your primary landing page analysis in Google Analytics, the “Top pages” section of the Search Queries Report does provide some additional value and again gives data you cannot get in Analytics.
Although the click data here is likely to be far less accurate than that in Google Analytics, this report does show you an approximate number of impressions, CTR and again the average position for that landing page in search results. This allows you to see how the page position affects CTR and shows where you might be able to make some good wins by developing pages with lots of impressions but a low average position.
For example, your top landing pages in Google Analytics may actually get fewer impressions than some other pages which struggle to rank on page one. Imagine if you could improve the ranking of that page with an average position of 11 that has five times as many impressions each month than your top performing landing page at position 2?
Limitations – Date Range And Accuracy
It is important to remember that this report is not as accurate as anything you would see in Google Analytics and is intended as an overview to help you understand how your site is performing in actual search queries, rather than from visitors as you would see in Google Analytics.
The numbers you see are very much approximations and should be used as such. That said, these are produced by Google based on actual search activity and so do give a good idea of what search terms are working well and those which are not.
In addition, you can currently only see data for the last 90 days although this is likely to increase in the coming months, as reported in this post from Search Engine Land. With the promise of a 12 month date range coming in the near future, this report could become even more useful.
Get In Touch
If you haven’t used this old report in a while I strongly recommend you dive back in and see what new information and insight you can gather. Be sure to play around with the filters and date ranges to see what you can learn. Let me know your experience and feedback in the comments section below.
Image Source
Data Concept via BigStock

Leave a Reply